blog
February 27, 2017 | Source: Admin User, Inc.
5 Steps To Selecting The Appropriate Statistical Test During RMM Validation
POSTED BY Admin User | 9 minute read
Learn more by getting in touch with Rapid Micro Biosystems today

Learn about the important advantages Growth Direct offers your facility

Regulators at the Food and Drug Administration (FDA) and European Medicines Agency (EMA) demand that the industry prove equivalence between RMM (rapid microbiology methods) and the compendial method using statistics.
Although there is some guidance in both the US and Europe, practical examples of using robust statistical models have not been available until recently.
Michael Miller, Ph.D. et al published a paper in European Pharmaceutical Review that helps solve the issue of selecting the appropriate statistical test during RMM validation.1 This article follows up on a paper by a team at Rapid Micro Biosystems (RMB) in the PDA Journal of Science and Technology.2 This paper provided a case study comparing a number of different characteristics between a compendial method and a rapid method, the Growth Direct™ system, and included a statistical test for equivalence. Both articles offer a good summary of the power of using an equivalence test to provide a statistical basis for comparability that will be much more effective than the use of 70% or 50-200% recovery criteria.
Following is a summary of their recommendations:
1. Formulate your hypotheses
First, formulate the null hypothesis (H0): a statement or claim that is a commonly accepted fact (e.g., flipping a coin will give 50% heads and 50% tails).
Now, assume the null hypothesis is true. Then formulate an alternative hypothesis (H1 or Ha) (e.g., the % of heads and tails is statistically different). The alternative hypothesis is what we want to prove. This requires experimentation.
This means two outcomes are possible:
2. Identify a statistical test
Identifying a statistical test (e.g., T-test, Chi-square, Fisher’s Exact Test, ANOVA, etc.) provides mathematical evidence to reject or fail to reject the null hypothesis.
Each test will provide a test statistic, which is a standardized value calculated from the sample data.
The test statistic is also used to calculate a “p-value.”
3. Calculate the p-value
Now it’s time to calculate the p-value, which is the probability of rejecting the null hypothesis when it is actually true.
The smaller the p-value, the stronger the evidence the null hypothesis is unlikely to be true (i.e., we reject the null and accept the alternative).
The greater the p-value, the more likely the null hypothesis is true (i.e., we fail to reject the null).
4. Compare the p-value to an acceptable significance value
The alpha (α) level is commonly determined by the consensus of the research community. Most use a 95% level of significance (α = 0.05). That means there is a 5% chance that the result is incorrect when you reject the null hypothesis.
If the p-value is ≤ 0.05, you reject the null hypothesis and accept the alternative hypothesis.
If the p-value is > 0.05, you fail to reject the null hypothesis.
Hypothesis testing and RMMs
In traditional hypothesis testing, the null hypothesis typically implies the sample populations are the same:
H0 = Both methods detect a similar number of positive/negative ratios in a sterility test
H0 = Both methods recover a similar number of cells in a quantitative assay
If the p-value is ≤ 0.05, the null is rejected, proving the methods are different (Ha). But if the p-value is > 0.05, the null is not rejected, thus not proving the methods are different. But this result does not prove the methods are the same! At least not statistically.
We haven’t proven that the two methods are the same; we just do not have enough evidence to prove they are different. How do we solve this problem? Through the use of an equivalence test.
5. Performing an equivalence test
In an equivalence test, H0 and H1 are reversed:
This provides a more rigorous statistical test proving the alternative (two methods are the same).
An equivalence test requires an additional step: you must decide on the size of an acceptable difference between the two populations, called the “zone of equivalence.”
Zone of equivalence
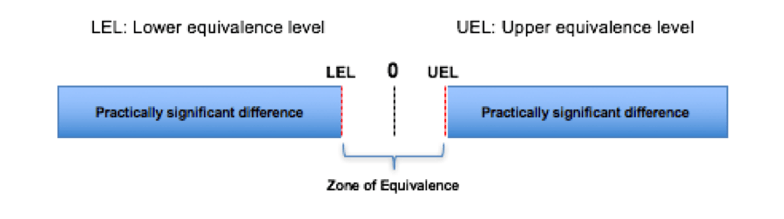
If the confidence interval (e.g., 95%) for the difference in the populations is within LEL and UEL, this is considered equivalence.
Also, if the p-value for the upper and lower bounds is ≤ 0.05, reject the null hypothesis and claim equivalence.
Now it’s time to select the LEL and UEL. Following are recommendations:
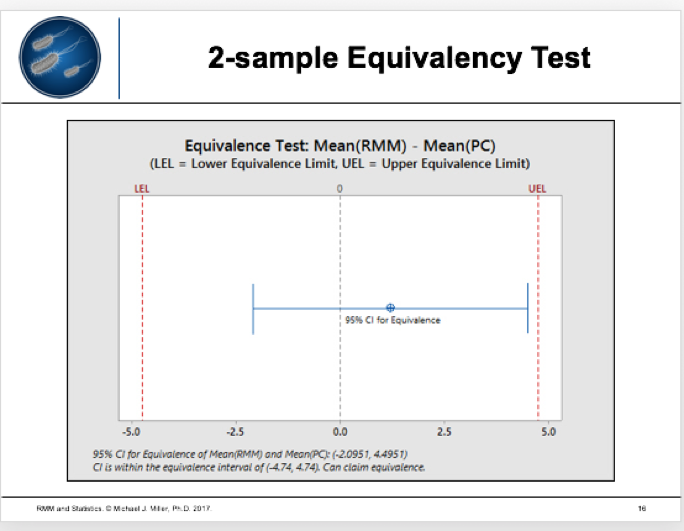
When performing the equivalence test, statistical software will prompt you to input the data and produce the results (e.g., Minitab 17).
Assume the following data for testing accuracy:
The RMM recovers 107.59% of the plate count (> 70%). However, you should also use a statistical test, such as a traditional 2-sample t-test or 2-sample equivalency test.
The results seem clear: when comparing RMM and a compendial test, equivalency tests provide the preferred model because they can statistically prove two methods are the same. For more details, read the full clinical article by Michael Miller et al in European Pharmaceutical Review.1
And contact Rapid Micro Biosystems about how automated compendial testing can help empower your manufacturing facility or lab with the power of automation.

References

