blog
August 13, 2010 | Source: Admin User, Inc.
Equivalency Tests & Rapid Method Validation or “Lies,damn lies,and statistics”
POSTED BY Admin User | 9 minute read
Learn more by getting in touch with Rapid Micro Biosystems today

Learn about the important advantages Growth Direct offers your facility

To the non-statistician, such as me, statistics can be a murky place, with its own set of jargon, tests and procedures. In the wrong hands, statistics can lead to some uncomfortable places, like passing a bad product, or failing the validation of a perfectly good rapid method. In my experience, statistical tests are often misapplied, even with the best of intentions. One such common misapplication is that of the Student’s t-test to show equivalency.
The t-test helps you figure out if two populations are significantly different. It compares two normally distributed data sets, and gives you a probability (p). The probability is the chance that, if the underlying populations were really the same, you’d get data that looked like what you got. Usually we choose to say the data sets are significantly different if p is less than or equal to 0.05. In other words, the difference is significant if there is a 5% or smaller chance that the two sample sets would look this different, if the underlying populations were really the same. This is also the same as saying you are 95% confident that the two samples are different: 100% - 5% = 95%. If you think about it, we still get fooled about 1 in 20 times using a 5% cut-off. Unless the t-test gives you a probability of something like 0.000001, keep an open mind about what it is really telling you. Of course, for QC, you need to have a cut-off, but you need to understand what that cut-off represents.
So, if a t-test gives you a probability of greater than 5% (p>0.05), can you say that the populations are the same? The answer is a resounding NO! The t-test can not be used to prove equivalence. It can only be used to say the data sets are “significantly different” or “not significantly different”. And that is where you start to run into trouble. “Not significantly different” is different from “equivalent”.
Not significantly different means that maybe the two sets are equivalent or maybe you just don’t have enough data to see the difference. In fact, using the t-test to “prove” equivalence rewards you for choosing too small a sample size (N) or having a large standard deviation. (Illustrated in lines B and C of figure 1).
So, what’s a microbiologist to do? Consider using a test called the TOST-test, or two-one sided t-test. This can be used to prove equivalence in the same sense that the t-test can be used to prove a difference.
What is the magic? With the TOST-test, you calculate the 90% confidence interval of the percent difference between your test group and your control and find if it falls within specified limits. What do I mean?
- Say your test counts come in at 92% of your control counts. That is a -8% difference.
- You do a statistical calculation to find the 90% confidence interval on the % difference, and you come up with something like -19% to 3%.
Are you equivalent? That depends on your specified limits, or theta (Θ). Theta must be chosen ahead of time, and is based on historical standard deviations of your data type, or on the required stringency. In microbiology, your theta may be +/-30% or +/-50%, so either way we would conclude that these two data sets are equivalent. A schematic view of the TOST-test can be seen in figure 1. The example just given is like line A in the figure.
Why use the 90% confidence interval, and not 95% confidence interval? Don’t we usually want to go with p=0.05, like in the T-test, and not p=0.10? Turns out that if you crank through the math, there is a division by 2, so your 90% confidence interval gives you significance at p=0.05. A 95% confidence interval would give you significance at p=0.025
Figure 1
Figure 2
Another thing: What if I just want to show my test method gives at least the counts of the control method, but I don’t care if the counts are higher? Well then, you use an OST-test, which is just like a TOST-test, except you only define the lower theta. The upper end of your 90% confidence interval can be as high as you like!
One last point of interest: Microbiological data follows the Poisson distribution, not the normal distribution; so technically, you should take the square root of all of your counts (which transforms the data into a normally distributed data) before applying the T-test or the TOST-test. However, in reality, these tests are robust and the answers you get won’t be that different with or without the square root transform.
Below I’ve included an example to illustrate the TOST test – happy calculating!
Julie Schwedock
Manager, Microbiology R&D
Rapid Micro Biosystems
TOST test - How to calculate lower confidence limit (LCL) and upper confidence limit (UCL) of % difference:
1. Calculate the averages for the control and the test method.
2. Calculate the standard deviation for each.
3. Calculate the pooled standard deviation as shown below:
pooledSD = sqrt(((SD12 * (N1-1)) + (SD22 * (N2-1)))/( N1+ N2-2))
Where:
- SD1 is the standard deviation of the control,
- SD2 is the standard deviation of the test method,
- N1 and N2 are the respective replicate numbers;
4. Look up the T value (Tval) based on a probability of 0.1 and (N1+ N2-2) degrees of freedom.
5. Calculate the lower limit of the confidence interval.
LCL= (X2-X1) – Tval*pooledSD*(sqrt((1/N1)+(1/N2)))
where X1 and X2 are the averages of the control and test assay replicates
6. Calculate the lower limit of the percent difference, %LCL= LCL/X1.
7. Calculate the upper limit of the confidence interval:
UCL= (X2-X1) + Tval*pooledSD*(sqrt((1/N1)+(1/N2)))
where X1 and X2 are the averages of the control and test assay replicates.
8. Calculate the upper limit of the percent difference, %UCL= UCL/X1, %UCL=UCL/X1
An example of the passing data set is given below:
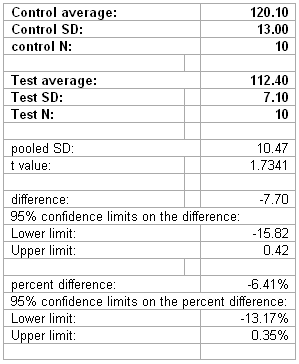
Hint: Set this all up in excel one time, and then change the inputs (in bold) as need be.

